
An overall assessment score tells a teacher how a learner performed across the paper. It rarely explains what to teach next. Topic-level analytics become useful when questions are mapped carefully, responses are interpreted with context, and the result leads to a specific instructional action.
The goal is a short evidence loop, not a more complicated dashboard.
Build the loop from questions to action
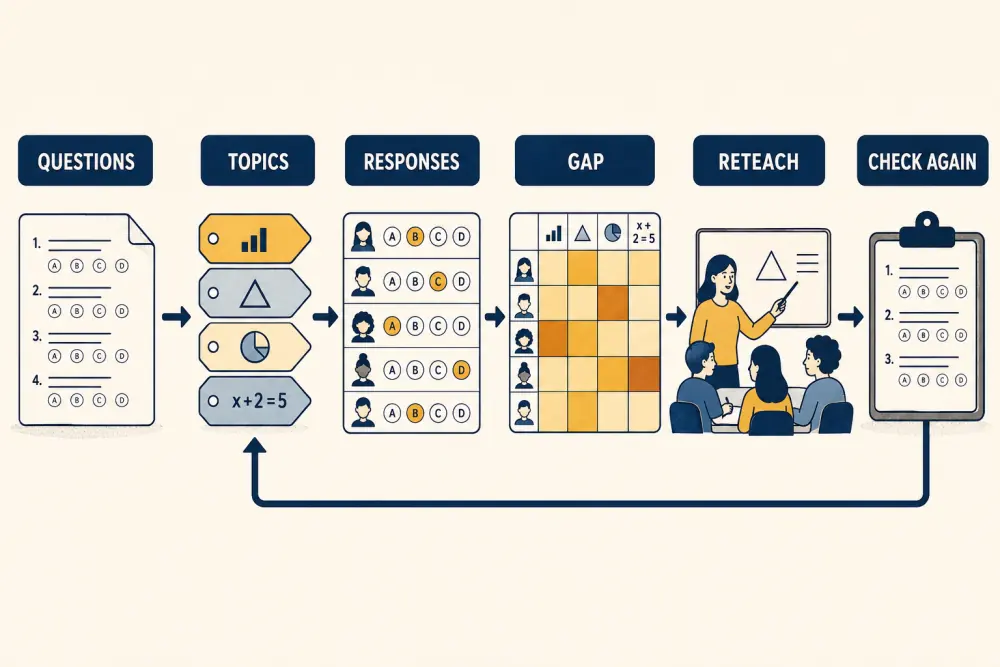
The workflow has six parts:
- Write questions for defined learning objectives.
- Map each question to one or more topics.
- Collect and validate student responses.
- Identify meaningful gaps at learner or group level.
- Reteach using an approach suited to the misconception.
- Check understanding again with a short follow-up task.
If any link is weak, the analysis can mislead. A chart cannot repair a poorly written question or an incorrect topic tag.
Map questions before the assessment
Tag questions while the assessment is designed, not after results are available. Record the topic, objective, cognitive demand, marks, and expected difficulty. Ask another teacher to review whether the item actually measures the intended skill.
Be cautious when one question covers several topics. Splitting marks by component may produce a clearer signal than assigning the entire item to one broad label.
Check data quality first
Before interpreting a heatmap, confirm that the answer key and marking rules are correct, all expected responses are present, and absent or exempt students are not treated as incorrect. Review questions with unusually low or high success rates.
If most learners choose the same distractor, it may reveal a misconception. It may also reveal confusing wording. Teachers need to inspect the item and sample responses before deciding.
Read patterns at more than one level
Class-level patterns help plan whole-group reteaching. Small clusters may need a targeted workshop. An individual pattern may justify practice, conversation, or an accommodation review. Use the smallest grouping that supports a reasonable teaching action.
Compare evidence across more than one item where possible. One mistake is weak evidence of topic mastery. Several varied questions, classroom observations, and prior work provide a more dependable picture.
Choose a response that fits the gap
Reteaching should not simply repeat the same explanation more slowly. Match the response to the likely problem: model a worked example, use a concrete representation, address a known misconception, pair learners for explanation, or provide guided practice.
Set a short objective for the intervention. “Students will distinguish area from perimeter in three new examples” is more actionable than “revise mensuration.”
Check again quickly
Use a small exit ticket, oral explanation, worked problem, or low-stakes digital quiz after reteaching. The follow-up should measure the same objective with a different example. Add the evidence to the learning record without overloading teachers with another full test.
A connected assessment workflow can keep questions, responses, topics, and follow-up evidence related while preserving teacher judgement.
Use analytics responsibly
Topic indicators are starting points, not fixed labels for learners or teachers. Limit access to people who need the information for instruction or support. Avoid public rankings and comparisons that ignore class context, assessment quality, attendance, or curriculum pacing.
Leaders using school analytics should look for resourcing and curriculum questions as well as performance: Does a grade need shared planning time? Is one objective being taught before its prerequisite? Do teachers need better items for a topic?
Run a weekly instructional review
Keep review meetings focused. Select one or two topic patterns, inspect the underlying questions, agree on an instructional response, name an owner, and choose how understanding will be checked. At the next meeting, review whether the response worked.
This rhythm is more valuable than producing many reports nobody has time to discuss.
Topic-analytics checklist
- Questions are mapped to objectives before delivery.
- A second teacher reviews important mappings and keys.
- Missing, absent, and exempt states are handled correctly.
- Unusual items are inspected before drawing conclusions.
- Decisions use multiple pieces of evidence where possible.
- Reteaching has a narrow, observable objective.
- A short follow-up check closes the loop.
- Results support learners rather than label them.
- Access is role-appropriate.
- Leaders connect patterns to teaching and resource decisions.
The useful outcome of analytics is not the heatmap; it is a better next lesson. Scholva can connect assessment evidence to topic views and role-appropriate reporting. Request a demonstration using one of your curriculum maps.
Related reading: Online assessments can reduce teacher grading workload and Early-warning signals school leaders should track.
For a related perspective, see Reading Your Own Marks: How to Work Out What Actually Went Wrong.