
A principal’s dashboard should answer a practical question: what needs attention today? It should not be a wall of every number the school can collect.
The most useful view combines a small set of timely signals with context, ownership, and a route to the underlying record. It helps leaders prioritise conversations and remove blockers while operational teams continue to own their work.
Turn signals into action
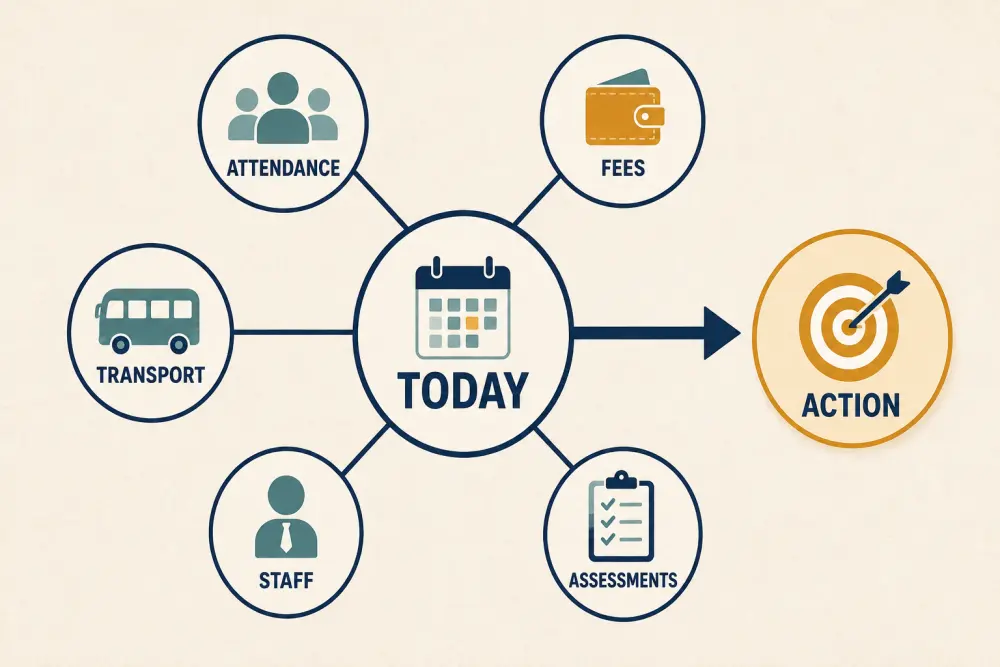
Attendance, fees, transport, staffing, and assessments are common signal groups, but the dashboard should reflect the institution’s real responsibilities. Each signal needs a definition, freshness indicator, comparison, accountable owner, and clear action path.
Begin with operational readiness
Show whether core morning processes are complete: student attendance submitted, staff attendance or substitutions resolved, transport exceptions acknowledged, and urgent service incidents assigned. Highlight missing data separately from an adverse result.
For example, “attendance lower than usual” and “three classes have not submitted attendance” require different actions. Combining them into one percentage hides the problem.
Use thresholds as prompts
Colour and alerts can direct attention, but every threshold should have an owner and rationale. A red indicator without a response plan creates anxiety rather than control.
Allow leaders to see the comparison period and underlying count. Small cohorts can produce dramatic percentages from one event. Trends should be reviewed alongside calendars, holidays, examinations, weather, and known operational changes.
Avoid automated conclusions about students, teachers, or campuses. The dashboard is a starting point for enquiry.
Keep attendance interpretable
Show submission completeness, present and absent counts, significant change from a suitable baseline, follow-up status, and repeated absence cases awaiting review. Distinguish excused absence, approved activity, late entry, and unknown status according to policy.
The detailed attendance workflow explains how classroom records become responsible parent alerts. The principal’s view should reveal where that workflow is delayed, not expose every child by default.
Separate fee position from collection activity
Useful fee signals may include payments awaiting reconciliation, dues approaching according to policy, failed or reversed transactions, approved concessions awaiting action, and unresolved parent cases. Do not put a public “best collector” ranking on a leadership dashboard.
Interpret collection figures with the fee calendar, enrolment changes, concessions, and reconciliation status. Financial access should remain restricted even when a principal sees an aggregate.
Surface transport exceptions
Show routes that have not started as expected, vehicle or driver changes, delayed acknowledgements, open safety incidents, and parent communications awaiting confirmation. Location data can be sensitive; an overview usually needs status and ownership rather than continuous historical traces.
Pair the dashboard with the escalation steps in the school bus safety and operations guide.
Make staffing gaps actionable
Highlight unfilled substitutions, unexpected absence, classes without an assigned teacher, and leave requests affecting near-term coverage. Keep medical details and private HR notes out of the general dashboard.
The action should lead to the schedule or substitution owner, not to an unrestricted employee file.
Distinguish assessment progress from outcomes
During an examination cycle, leaders may need paper readiness, scheduling conflicts, marks-entry completion, moderation, publication readiness, and unresolved corrections. After publication, trends can support academic review.
Do not compare performance before checking assessment design, cohort, coverage, and data completeness. Topic analysis is useful when it leads to planned teaching support, as described in our reteaching guide.
Add context and accountability
Every exception should show the current owner, when it changed, agreed next step, and due time where appropriate. Leaders should be able to acknowledge, assign, or open the source workflow without copying the issue into another tracker.
Keep a brief decision history for important interventions. This prevents the same question from being rediscovered in repeated meetings.
Review at different rhythms
The daily view is for readiness and exceptions. A weekly view can examine recurring delays and workload. Monthly or term reviews can cover trends, service quality, academic progress, and improvement plans. Mixing all three rhythms on one screen weakens each.
Ask leaders what decisions the dashboard changed. Remove indicators that are admired but never used.
Daily dashboard checklist
- Limit the first view to signals requiring attention.
- Show freshness, completeness, count, and comparison context.
- Distinguish missing data from negative performance.
- Attach every threshold to an owner and response.
- Protect student, finance, HR, and location details by role.
- Link summaries to their source workflow.
- Record assignment and resolution of important exceptions.
- Use daily, weekly, and term views for different decisions.
- Review false alarms and unused indicators.
Scholva’s connected analytics can help leaders move from operational signals to the responsible workflow. Request a demonstration to design the view around your school day.
Related reading: Early-warning signals for school leaders, managing multiple campuses from one source of truth, and future-ready education leadership.